


Summary: Anchorage (Airport) is seeming to warm at a similar rate as Fairbanks Airport and feature more precipitation overall, and precipitation falling as rain than it did 50 years ago.
Alright, after going for Fairbanks yesterday, let’s take a look at Anchorage.
Disclaimer: There was some controversy around using the airport station for Fairbanks, unfortunately I do not know enough about the local geography beyond super rudimentary information to go beyond the default output when I run a certain location through my script. I recognize those concerns, and in a final, hopefully openly accessible version of my site, those will be addressed.
Let us get to it then, similar graphs, similar location bias (Anchorage Int’l).

Certainly featuring a slightly higher baseline than Fairbanks, the trend is unequivocal. In fact, let us compare the two briefly to see if a similar warming trend can be observed in both stations; here’s the respective graph for Fairbanks:

Looks as though while 2019 was warm in both locations, 1993 shows a (much) higher peak further inland. Nothing that is not to be expected, the two locations are more than 300 miles and a few mountain ranges apart. What seems definite however is the warming trend, so much like yesterday, let us take a look at the departure from a (somewhat arbitrarily) chosen baseline climate (1950-1979) for Anchorage:

Indeed, the departure from the set normal is even higher than in Fairbanks, featuring the warmest year in 2019 for the maximum, minimum, and average temperature across the board. Note additionally how five of the six warmest maximum temperature averages feature since 2014 (with the final year of the graph being 2019). For the minimum temperature it is 5 out of 5. This does constitute a statistically significant increase.
Time to look at the growing season and precipitation graphs then, here goes:

Note: The red line denominates consecutive frost-free days in a given year, the blue line the opposite thereof. Similar to Fairbanks an increase in freeze-free days appears definite, though not quite as pronounced (remember, Fairbanks featured about a 40 day increase in 90 years); which may very well be due to the shorter period of observation.
Things become truly interesting if we look at precipitation:

Most definitely related to the super year wet year 2022, the average amount of rain is up almost 5 inches since 1953, or 30 some %. I am using calendar years for this analysis, as I work my way further down the West Coast, I will likely switch over to Water Years (Oct-Sep) as they are more meaningful in analyzing precipitation in climates with distinct wet and dry season. Either way, the amount of rain does seems to correlate with the amount of snow ever so slightly, meaning that there is not only more precipitation in any given year expected, but also notable increase in the percentage of rainy as opposed to snowy days now compared to fifty years ago. Let’s take a look at the actual number of days it is either rainy or snowy:
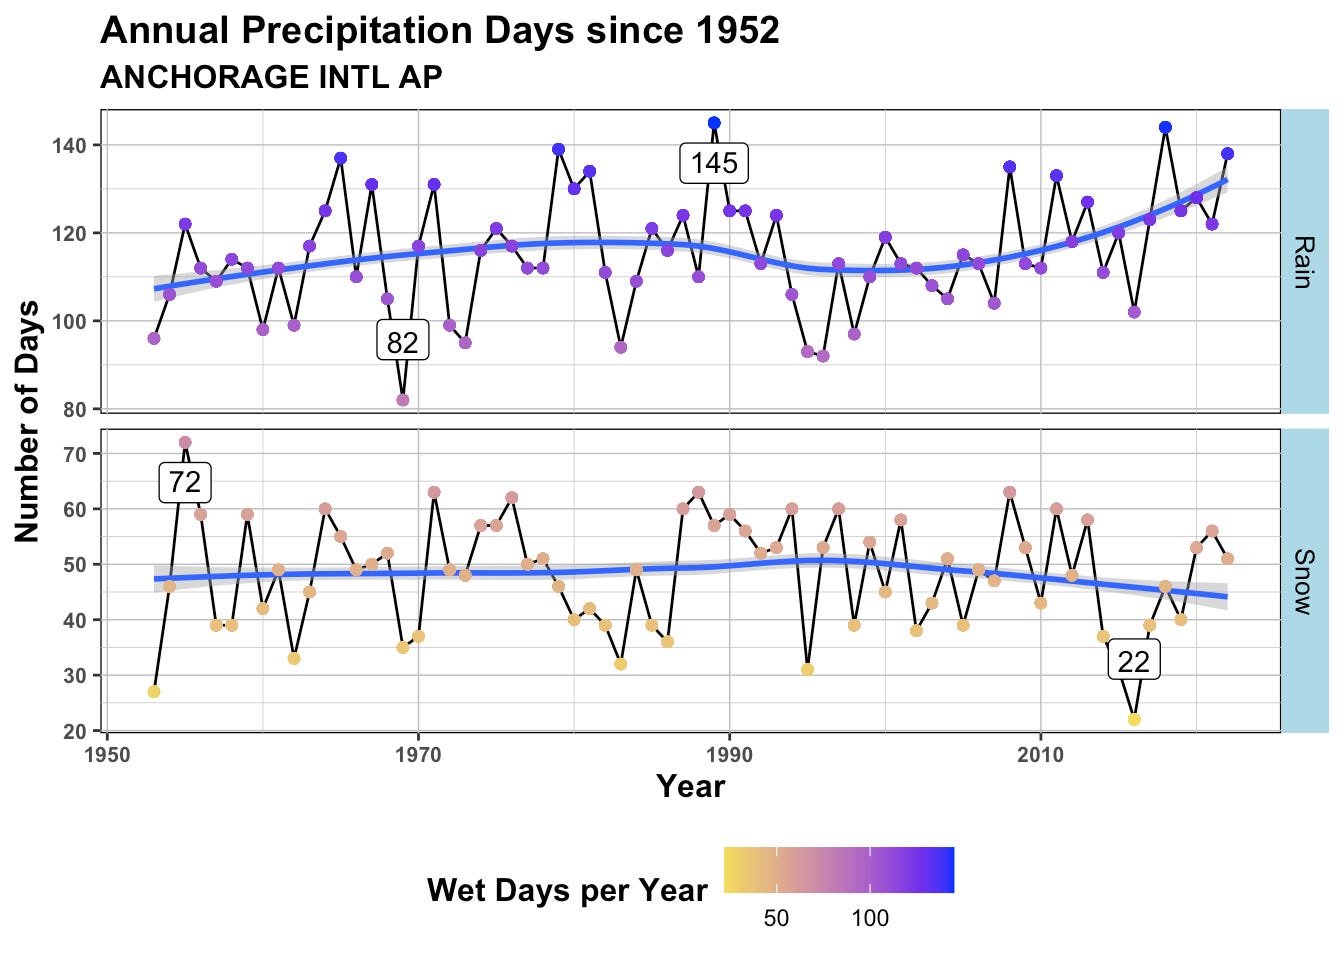
Any given day can be counted in both those graphs (i.e. it snowed and rained during the same days), so the most appropriate deduction here is that about 130 days a year appear to feature precipitation rather than 180 (snowy+rainy days). Either way, the same trend of more rain and less snow is quite pronounced. While snowy days appear to become rarer ever so slightly, there is a substantial increase in rainy days one can expect. Due to the aforementioned possibility of double counting it is hard to assess based on this graph alone whether wet days (rain or snow) are getting more frequent overall in a warming climate, or if this increase in rainy days is directly related to the decrease in snowy days. My guess is: Both; at least to an extent.
To underline that claim, let’s look at the change in precipitation based on season1.

I want to emphasize the significant increase in rain amounts during fall season in the last few years, seemingly correlated to the decrease in snowy days. That fits well into my understanding of the local climate: As the surrounding ocean warms and sea ice is lost (of course this effect is MUCH more pronounced along Alaskas west and north coasts), (late) fall temperatures warm to a point where liquid is much more likely to fall as rain as opposed to snow much later in the season. The other noteworthy feature from this output appears to be the slight increase of rain during summer months - this is something that would be adding to the overall total as opposed to simply exchanging rainy for snowy days.
So in conclusion: Anchorage (Airport) is seeming to warm at a similar rate as Fairbanks Airport and feature more precipitation overall, and precipitation falling as rain than it did 50 years ago.
Cheers, and thank you for taking the time!
As yesterday, here a few graphs related to today’s analysis:


Note that I define seasons by their meteorological definition: June 1st is the start of summer, Sep 1st the start of fall, Dec 1st the start of winter, and Mar 1st the start of spring.